Direct Booking Engine vs OTA: ROI Case Study for Small Hotels
Introduction
OTAs are a practical way to fill rooms. They drive immediate demand and revenue for your hotel.
However, OTAs come with both visible and hidden costs. The visible cost is commission. The hidden cost is dependence.
When a third party controls a large share of your revenue—whether it’s an OTA, Google, or a social platform—you are exposed to that platform’s policy changes and payout decisions. That is a weak foundation for an independent hotel.
In 2020, COVID-19 disruptions led major travel platforms to implement broad refund and cancellation policies at scale, sometimes overriding hotel cancellation terms. In 2023, Booking.com partners reported payout delays that created cash-flow gaps for many hotels.
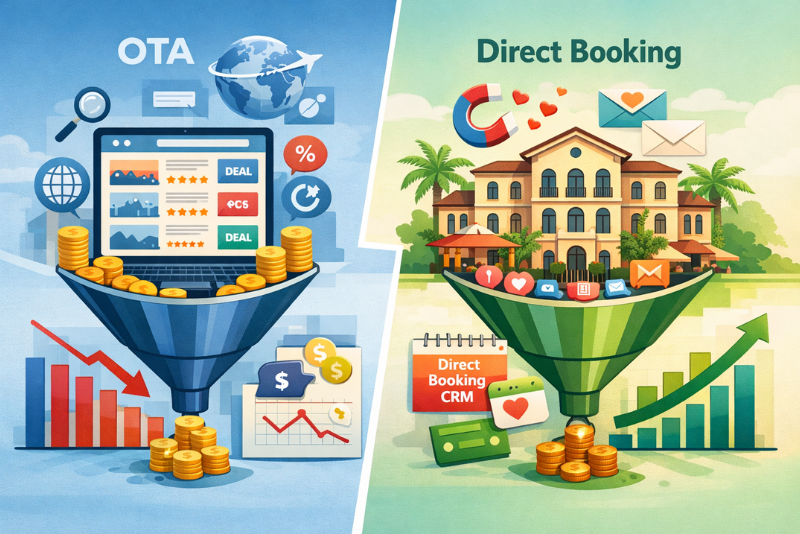
OTAs still offer real value. They are done-for-you marketing. They bring built-in demand, a familiar booking flow, and a marketplace where travelers can quickly compare options.
The trade-off is that you rent your marketing channel rather than building one. Inside an OTA, you tend to compete on price and ranking. You end up playing an algorithm you do not control. Your results can change when the platform changes how it sorts, promotes, or packages listings.
Independent hotels that build their own marketing channel stay profitable even when the market softens. They compete on value rather than price. Demand and repeat bookings come through systems the hotel operates—rather than decisions made by a marketplace.
This paper addresses a practical question: Is it worth building your own marketing channel? Using a five-year model, it quantifies the value of investing in direct acquisition and repeat bookings, thereby reducing OTA commission over time. The goal is not to eliminate OTAs.
The objective is to implement durable channels, reduce OTA booking dependence, and increase profitability.
What this paper measures
This paper compares OTA dependence, the cost of developing an independent marketing channel, and the resulting revenue increase from shifting bookings from an OTA to a direct channel.
OTA booking dependency = the percentage of total bookings that come through OTAs.
The paper then translates reduced dependency into dollars:
- Fewer OTA bookings
- Less commission paid
- Annual net impact after marketing spend
How the direct channel is defined
In this paper, “direct” means bookings made on the hotel’s own booking path (website and booking engine), regardless of where the guest first discovered the property.
A direct program is treated as:
- Paid acquisition (Ads, retargeting)
- SEO and content (pages that grow in value over time)
- Repeat bookings (driven by a hotel CRM & Email or SMS messaging)
Assumptions used in the model
Spend assumptions
The model assumes the direct channel costs as follows:
- Paid ads spend: the annual budget for paid guest acquisition.
- SEO/content spend: the annual budget for content and SEO production.
- Customer Relationship Manager (CRM): Annual software expense for improved guest re-marketing and relationship management.
Total direct marketing spend is the sum of those three.
Performance assumptions
This model assumes performance improves over time for the following reasons:
- SEO compounds. Pages can continue to generate bookable demand after publication.
- Conversion improves. The booking path and tracking get tighter over time.
- Repeat bookings increase. Past guests become a meaningful source of bookings (CRM).
Hotel website conversion rates are typically ~2%, leaving substantial room for improvement when conversion is treated as an operational project rather than a one-time website task. (HSMAI Europe)
CRM assumptions
The paper considers two cases: with and without CRM software.
Without a CRM
- Repeat booking growth rate is slower.
- Conversion improvements are slower.
- Paid spend tapers more gradually. (SEO & rebooking efforts are less effective)
- Long-run OTA dependency stays higher.
With a CRM
The CRM is treated as a performance booster. It affects the model in three ways:
- It increases repeat bookings through automated lifecycle messaging.
- It improves conversion efficiency over time (more bookings per dollar).
- It reduces manual guest communication.
This case estimates 200 hours per year saved across the portfolio through automation. (This was converted into a dollar offset – see appendix.)
Paid taper and fixed SEO
To keep the model realistic for a small operator:
- SEO/content spend stays flat in both cases. Compounding comes from authority growth and increased effectiveness of existing assets.
- Paid spend decreases over time, particularly with a CRM, as more bookings come from organic capture and repeat business.
Commission assumptions
The base case uses an effective OTA commission rate of 20%.
OTA commission is commonly cited as 15–30%, depending on the market and agreement. (Cloudbeds)
Case inputs
This is a boutique-market example designed to feel realistic for higher-rate destinations.
- Hotel size: 23 rooms
- Annual room revenue: $2,000,000
- Starting OTA booking dependency: 80%
- Effective OTA commission: 20%
- Estimated annual bookings: 2,938
- Baseline OTA bookings: 2,351
- Revenue per booking: $680
- Commission avoided per displaced OTA booking: $136
(How these numbers are derived is shown in the appendix.)
Five-year model without a hotel CRM
| Year | Paid ads spend | SEO/content spend | CRM net cost | Total program spend | OTA booking dependency | OTA bookings | OTA bookings displaced | Commission avoided | Net impact |
| 0 | — | — | — | — | 80% | 2,351 | — | — | — |
| 1 | $36,000 | $24,000 | $0 | $60,000 | 75% | 2,204 | 147 | $19,992 | –$40,008 |
| 2 | $34,000 | $24,000 | $0 | $58,000 | 69% | 2,027 | 324 | $44,064 | –$13,936 |
| 3 | $32,000 | $24,000 | $0 | $56,000 | 62% | 1,822 | 529 | $71,944 | +$15,944 |
| 4 | $30,000 | $24,000 | $0 | $54,000 | 56% | 1,646 | 705 | $95,880 | +$41,880 |
| 5 | $28,000 | $24,000 | $0 | $52,000 | 52% | 1,528 | 823 | $111,928 | +$59,928 |
Note: CRM net cost is shown as $0 only for table consistency. This scenario assumes no CRM is used.
Five-year model with a hotel CRM
| Year | Paid ads spend | SEO/content spend | CRM cost – labor savings – net $0 | Total program spend | OTA booking dependency | OTA bookings | OTA bookings displaced | Commission avoided | Net impact |
| 0 | — | — | — | — | 80% | 2,351 | — | — | — |
| 1 | $36,000 | $24,000 | $0 | $60,000 | 68% | 1,998 | 353 | $48,008 | –$11,992 |
| 2 | $28,000 | $24,000 | $0 | $52,000 | 54% | 1,587 | 764 | $103,904 | +$51,904 |
| 3 | $20,000 | $24,000 | $0 | $44,000 | 42% | 1,234 | 1,117 | $151,912 | +$107,912 |
| 4 | $16,000 | $24,000 | $0 | $40,000 | 32% | 940 | 1,411 | $191,896 | +$151,896 |
| 5 | $12,000 | $24,000 | $0 | $36,000 | 25% | 735 | 1,616 | $219,776 | +$183,776 |
Note: In this case study, CRM is modeled as cost-neutral: annual CRM software and operating cost is assumed to be offset by labor savings from automation (200 hours/year). The CRM benefit is reflected in faster reduction of OTA dependencies and the ability to taper paid ads more quickly.
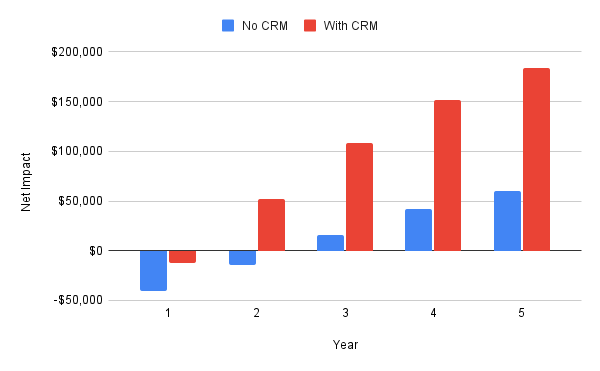
How to read these results
1) Higher room rates make the economics stronger
In higher-rate markets, each displaced OTA booking yields greater commission revenue. That moves the break-even point earlier.
2) Early years are not “steady state”
Year 1 is not the final performance level. The model assumes the direct channel improves over time. That is why the tables run for five years. This is common with SEO assets and a CRM. The value of these assets compounds over time.
3) A CRM changes the shape of the curve
CRM doesn’t replace marketing. It increases what marketing produces:
- Increased repeat bookings
- Better conversion efficiency
- Less manual work to run guest messaging
4) OTA dependence does not go to zero
The model flattens because some demand remains OTA-native. OTAs are still a valuable channel even with a direct marketing system. They increase visibility and are an excellent source for non-repeat customers that can be converted into direct bookings over time. They grow your tribe.
Appendix
Appendix A: How the case inputs are calculated
Annual room nights sold
Rooms × 365 × occupancy
Annual bookings
Annual room nights ÷ average length of stay
Baseline OTA bookings
Annual bookings × starting OTA booking dependency
Revenue per booking
Average daily rate × average length of stay
Commission avoided per displaced booking
Revenue per booking × effective OTA commission
Appendix B: Equations used in the tables
- OTA bookings displaced = baseline OTA bookings − OTA bookings in that year.
- Commission avoided = OTA bookings displaced × revenue per booking × effective OTA commission.
- Net impact = commission avoided − total program spend.
If you want to show the labor savings explicitly, add:
- Net impact = commission avoided − total program spend − CRM operating cost + labor savings value.
Appendix C: Benchmarks used
- OTA commission rates are commonly cited at 15–30%. (Cloudbeds)
- Hotel website conversion rates are typically around 2%. (HSMAI Europe)